电池电极过程可视化与定量化技术的研究进展
Progresses in visualization and quantitative analysis of the electrode process in rechargeable batteries
电池电极过程可视化与定量化技术的研究进展 |
| 吕思奇, 李娜, 陈浩森, 焦树强, 宋维力 |
|
Progresses in visualization and quantitative analysis of the electrode process in rechargeable batteries |
| Siqi LYU, Na LI, Haosen CHEN, Shuqiang JIAO, Weili SONG |
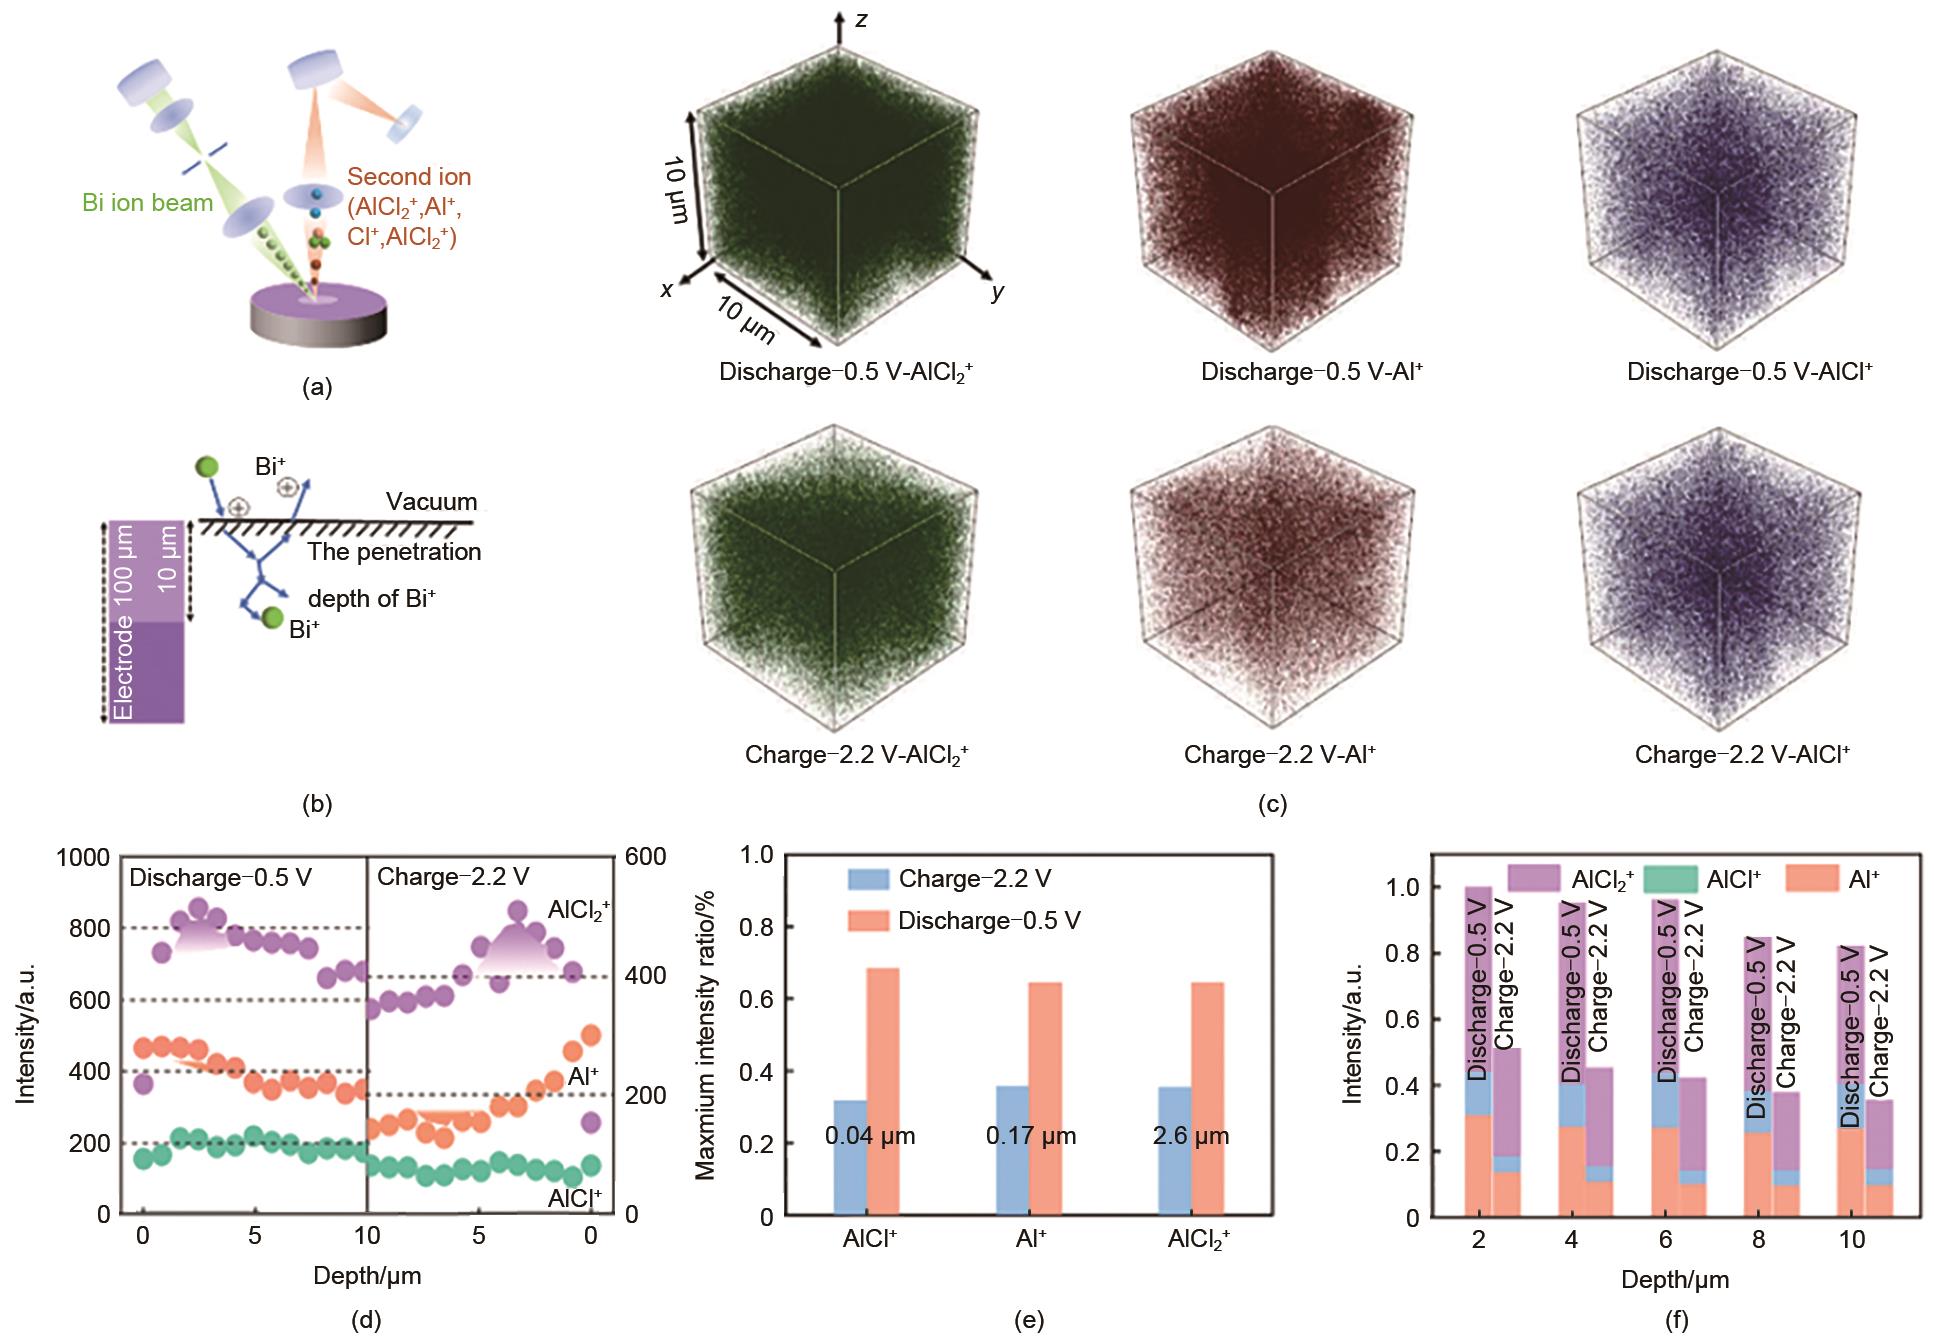
| 图12 (a) TOF-SIMS原理图;(b) 深层溅射图;(c)-0.5 V放电与-2.2 V充电深度剖面对应的溅射体三维图像;(d) 铝系列中二次离子深度分布;(e) 充放电过程中三种离子在其最大含量深度处的比值;(f) 三种离子在不同深度处含量比[ |
| Fig. 12 (a) the schematic diagram of TOF-SIMS; (b) the diagram of deep sputtering; (c) 3D images of the sputtered volume corresponding to the depth profiles at discharge -0.5 V and charge -2.2 V; (d) the depth profiles of secondary ions in aluminum series; (e) the ratio of three ions at the depth of their maximum contents during charge and discharge processes, and (f) the content ratio of three ions at different depths[ |
|
|