硅基负极与电解液化学反应的分析与抑制策略
The analyses and suppressing strategies of silicon anode with the electrolyte
硅基负极与电解液化学反应的分析与抑制策略 |
| 于春辉, 何姿颖, 张晨曦, 林贤清, 肖哲熙, 魏飞 |
|
The analyses and suppressing strategies of silicon anode with the electrolyte |
| YU Chunhui, HE Ziying, ZHANG Chenxi, LIN Xianqing, XIAO Zhexi, WEI Fei |
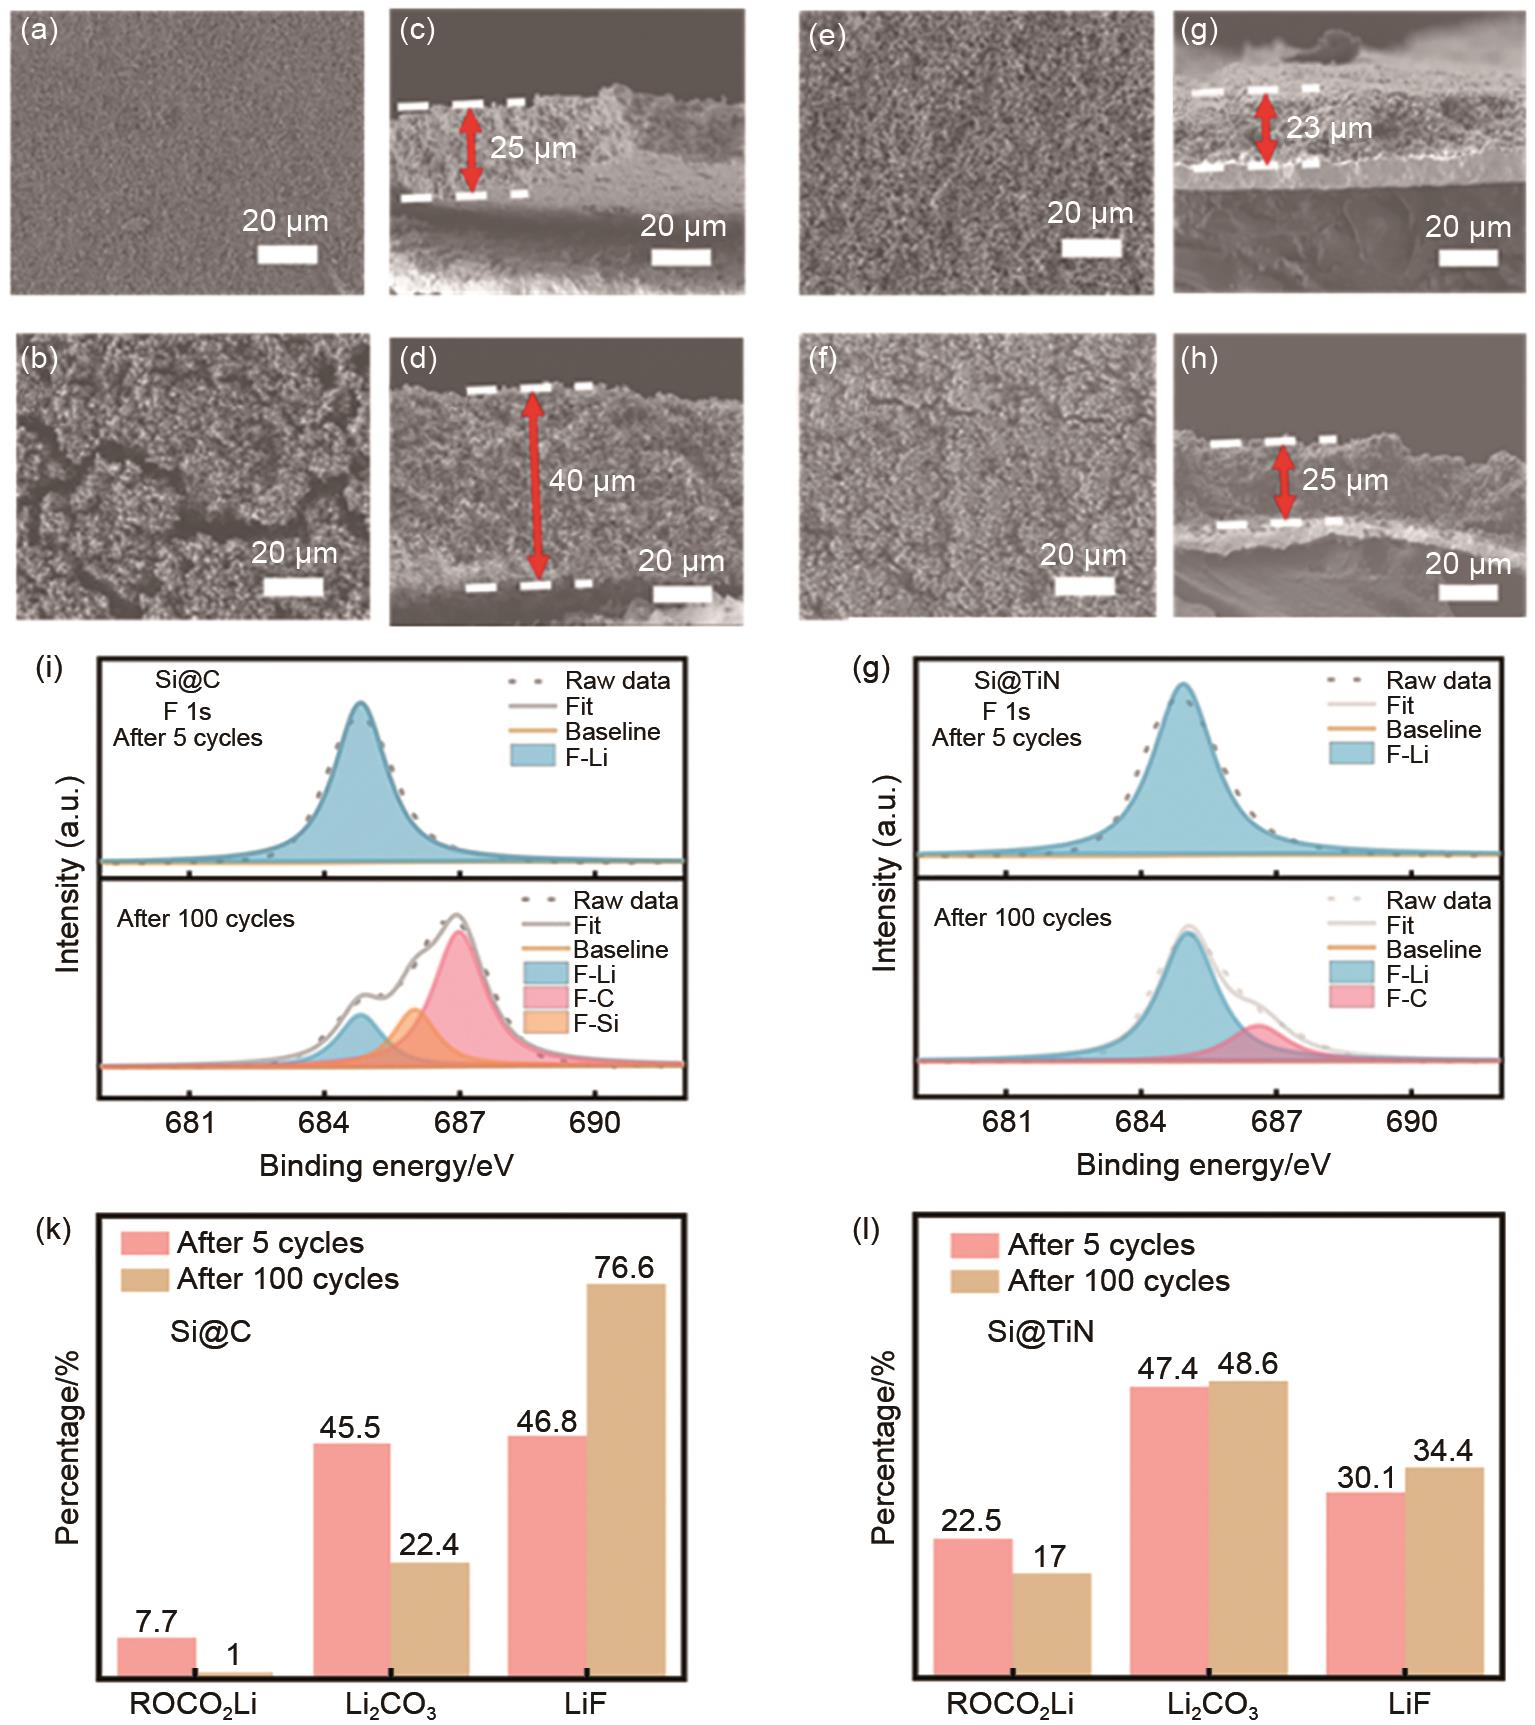
| 图7 Si@C和Si@TiN循环前后对比。(a) Si@C循环之前的SEM;(b) Si@C循环前的截面图;(c) Si@C循环5圈之后的SEM;(d) Si@C循环5圈之后的截面图;(e) Si@TiN循环之前的SEM;(f) Si@TiN 循环前的截面图;(g) Si@TiN循环5圈之后的SEM;(h) Si@TiN循环5圈之后的截面图;(i) Si@C循环5圈后100圈后的XPS结果对比;(g)Si@TiN循环5圈后100圈后的XPS结果对比;(k) Si@C循环5圈后100圈后的各组分结果对比;(l)Si@TiN循环5圈后100圈后的各组分结果对比 |
| Fig. 7 The Comparison of Si@C and Si@TiN after different cycles. (a) SEM image of fresh Si@C; (b) SEM image of Si@C after 5 cycles; (c) Top-view SEM image of fresh Si@C; (d) Top-view SEM image of Si@C after 5 cycles; (e) SEM image of fresh Si@TiN; (f) SEM image of Si@TiN after 5 cycles; (g) Top-view SEM image of fresh Si@TiN; (h) Top-view SEM image of Si@C after 5 cycles; (i) XPS data of Si@C after different cycles; (j) XPS data of Si@TiN after different cycles; (k) Relative percentage of different components for Si@C; (l) Relative percentage of different components for Si@TiN |
|
|