原位表征技术在水系有机液流电池中的研究进展
Research progress on in-situ characterization techniques for aqueous organic flow batteries
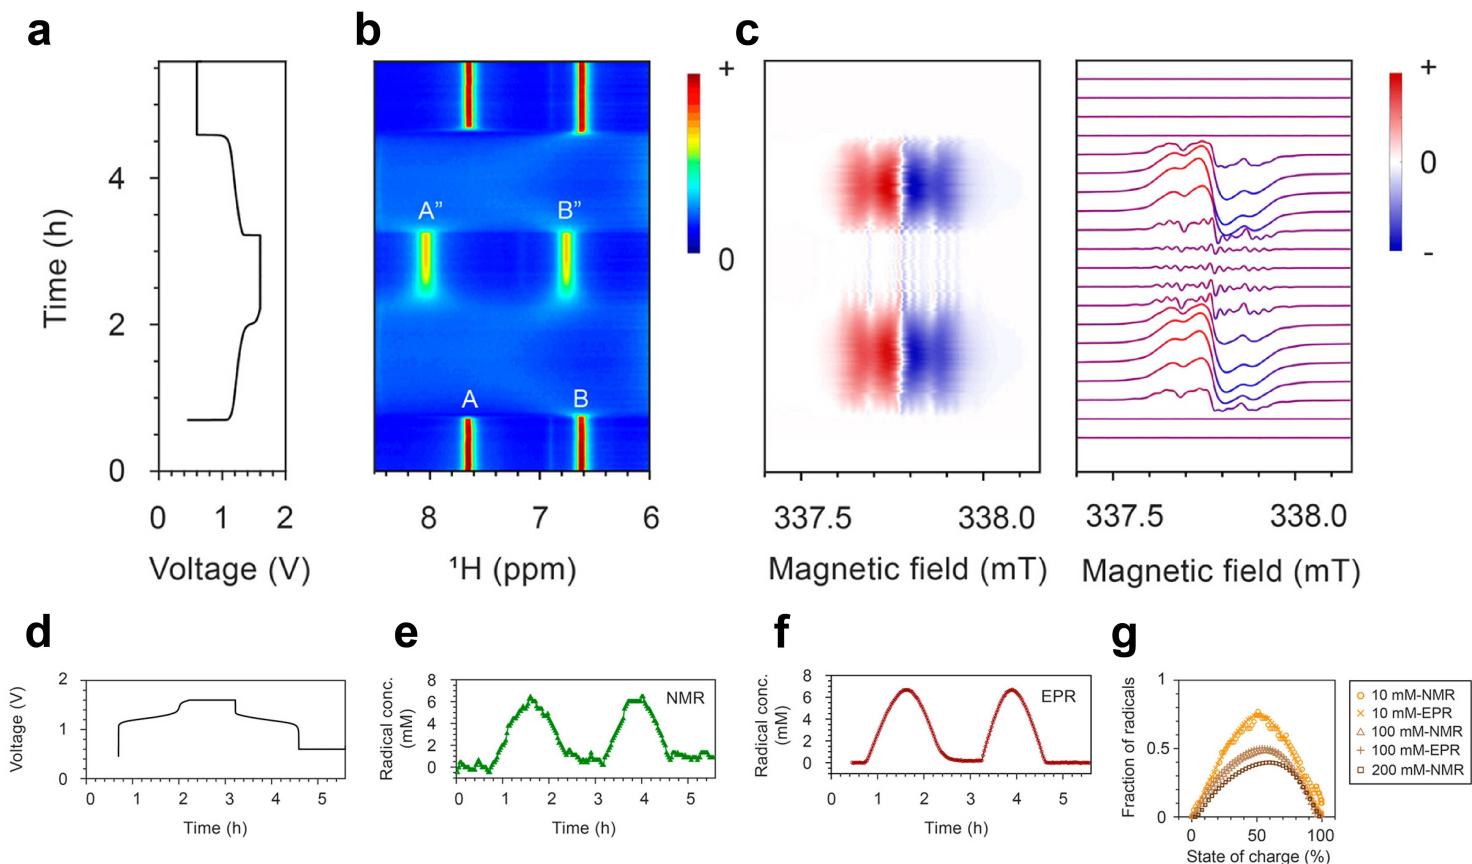
图9. a,d 10 mM DHAQ 与15 mM K4[Fe(CN)6] and 3.75 mM K3[Fe(CN)6] 组装的全电池电压随时间变化的曲线图。b负极电解质芳环区的NMR谱图。c负极电解液的EPR谱图。e,f DHAQ3–?自由基浓度随时间变化的分别通过NMR光谱中水共振的体磁化率位移和EPR实验中的自旋计数来估计。d自由基的分数作为总浓度10,100和200mm DHAQ的电荷状态的函数。
Fig.9. a, d Voltage of a 10 mM DHAQ versus 15 mM K4[Fe(CN)6] and 3.75 mM K3[Fe(CN)6] full cell as a function of time. b NMR spectra of the anolyte in the aromatic region. c EPR spectra of the anolyte. e, f Concentrations of DHAQ3–? radical anions as a function of time, estimated from the bulk magnetic susceptibility shift of the water resonance in the NMR spectra and by spin counting in the EPR experiments, respectively. d Fractions of radicals as a function of state of charge for total concentrations of 10, 100, and 200 mM DHAQ.

